2D3Dscopy. Resource Characterization: from 2D to 3D microscopy
Contact: Jonathan Sittner & Asim Siddique
Analytical methods play an indispensable role for the characterization of raw materials. But most of them lack of a 3-dimensional (3D) information which is important for understanding the structural character of ores. However, X-ray computed tomography (CT) provides this 3D information and has been used in geoscience for the last few decades. It offers several advantages such as its non-destructive character and the low requirements for the sample preparation which make this technique unique. Nevertheless, there are some limitations due to the resolution and the lack of chemical information which is particularly important for the determination of mineral phases in a sample.
In this project, the University of Ghent is collaborating with the Helmholtz Institute Freiberg for resource technology, TESCAN XRE, and Outotec to merge 2-dimensional (2D) data with 3-dimensional X-ray CT. In this context a new analytical technique called spectral X-ray computed micro tomography is used to obtain chemical data from a sample by using a semiconductor detector. With the detection of the X-ray absorption spectrum and therefore of the K-edge position, different elements can be analyzed from Ag up to U.
A combination of this technique with quantitative high resolution 2D data provides better information of mineral composition and liberation, grinding fineness, and in the estimation of the sortability of an ore. The method can be used for the resource estimation of an ore, quality control on the material itself as well as a prediction of the behavior of the material in the next processing steps.
This upscaling project has received funding from the European Institute of Innovation and Technology (EIT), a body of the European Union, under the Horizon 2020, the EU Framework Programme for Research and Innovation.
Watch the promotional video here.
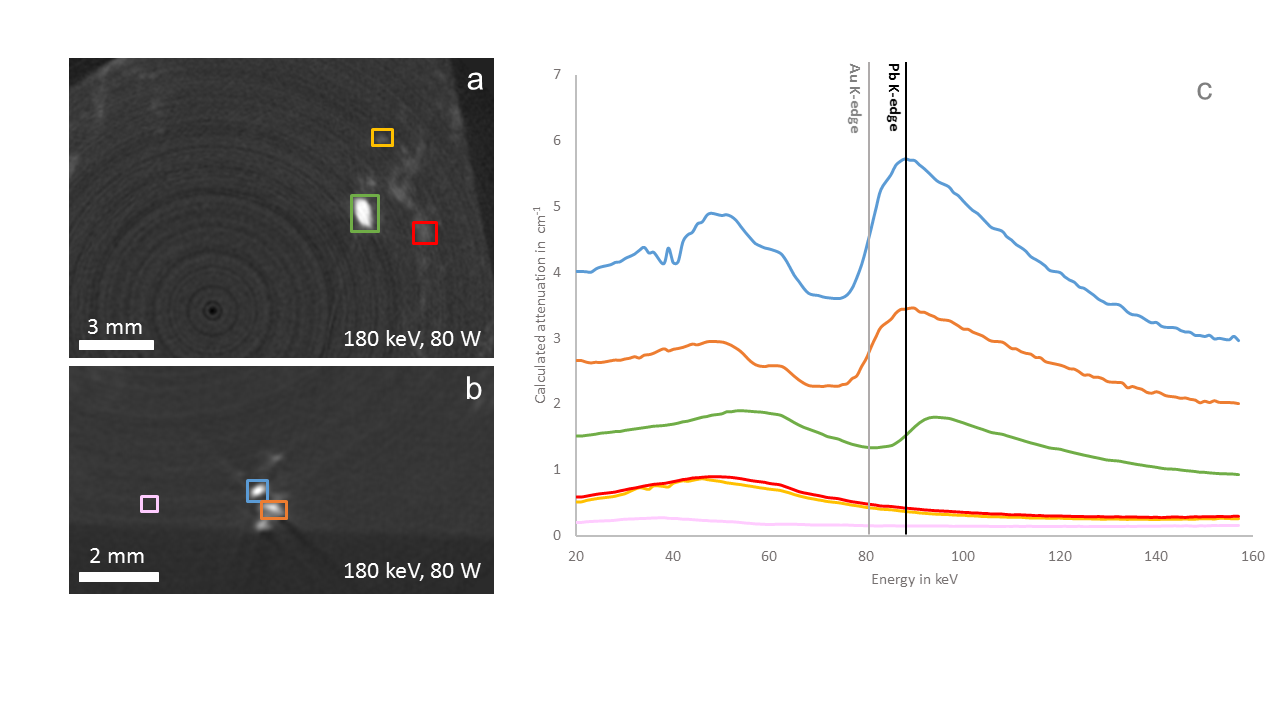
FIGURE: (a) and (b) Reconstructed Sp-CT images (180 keV, 80 W) of two different planes in the natural gold ore sample (c) energy spectra of different particles indicated in (a and b) with the corresponding colors and theoretical positions of the Pb and the Au K-edges; note that the three spectra (red, yellow, and pink) possibly represented by sulfide minerals or silicates show no K-edge in the spectral range (NIST X-Ray Transition Energies Database; Deslattes et al., 2003). From Sittner et al., 2020.