Overview
Contact: Veerle Cnudde
- Understanding the chemical and structural characteristics of raw materials in 3D.
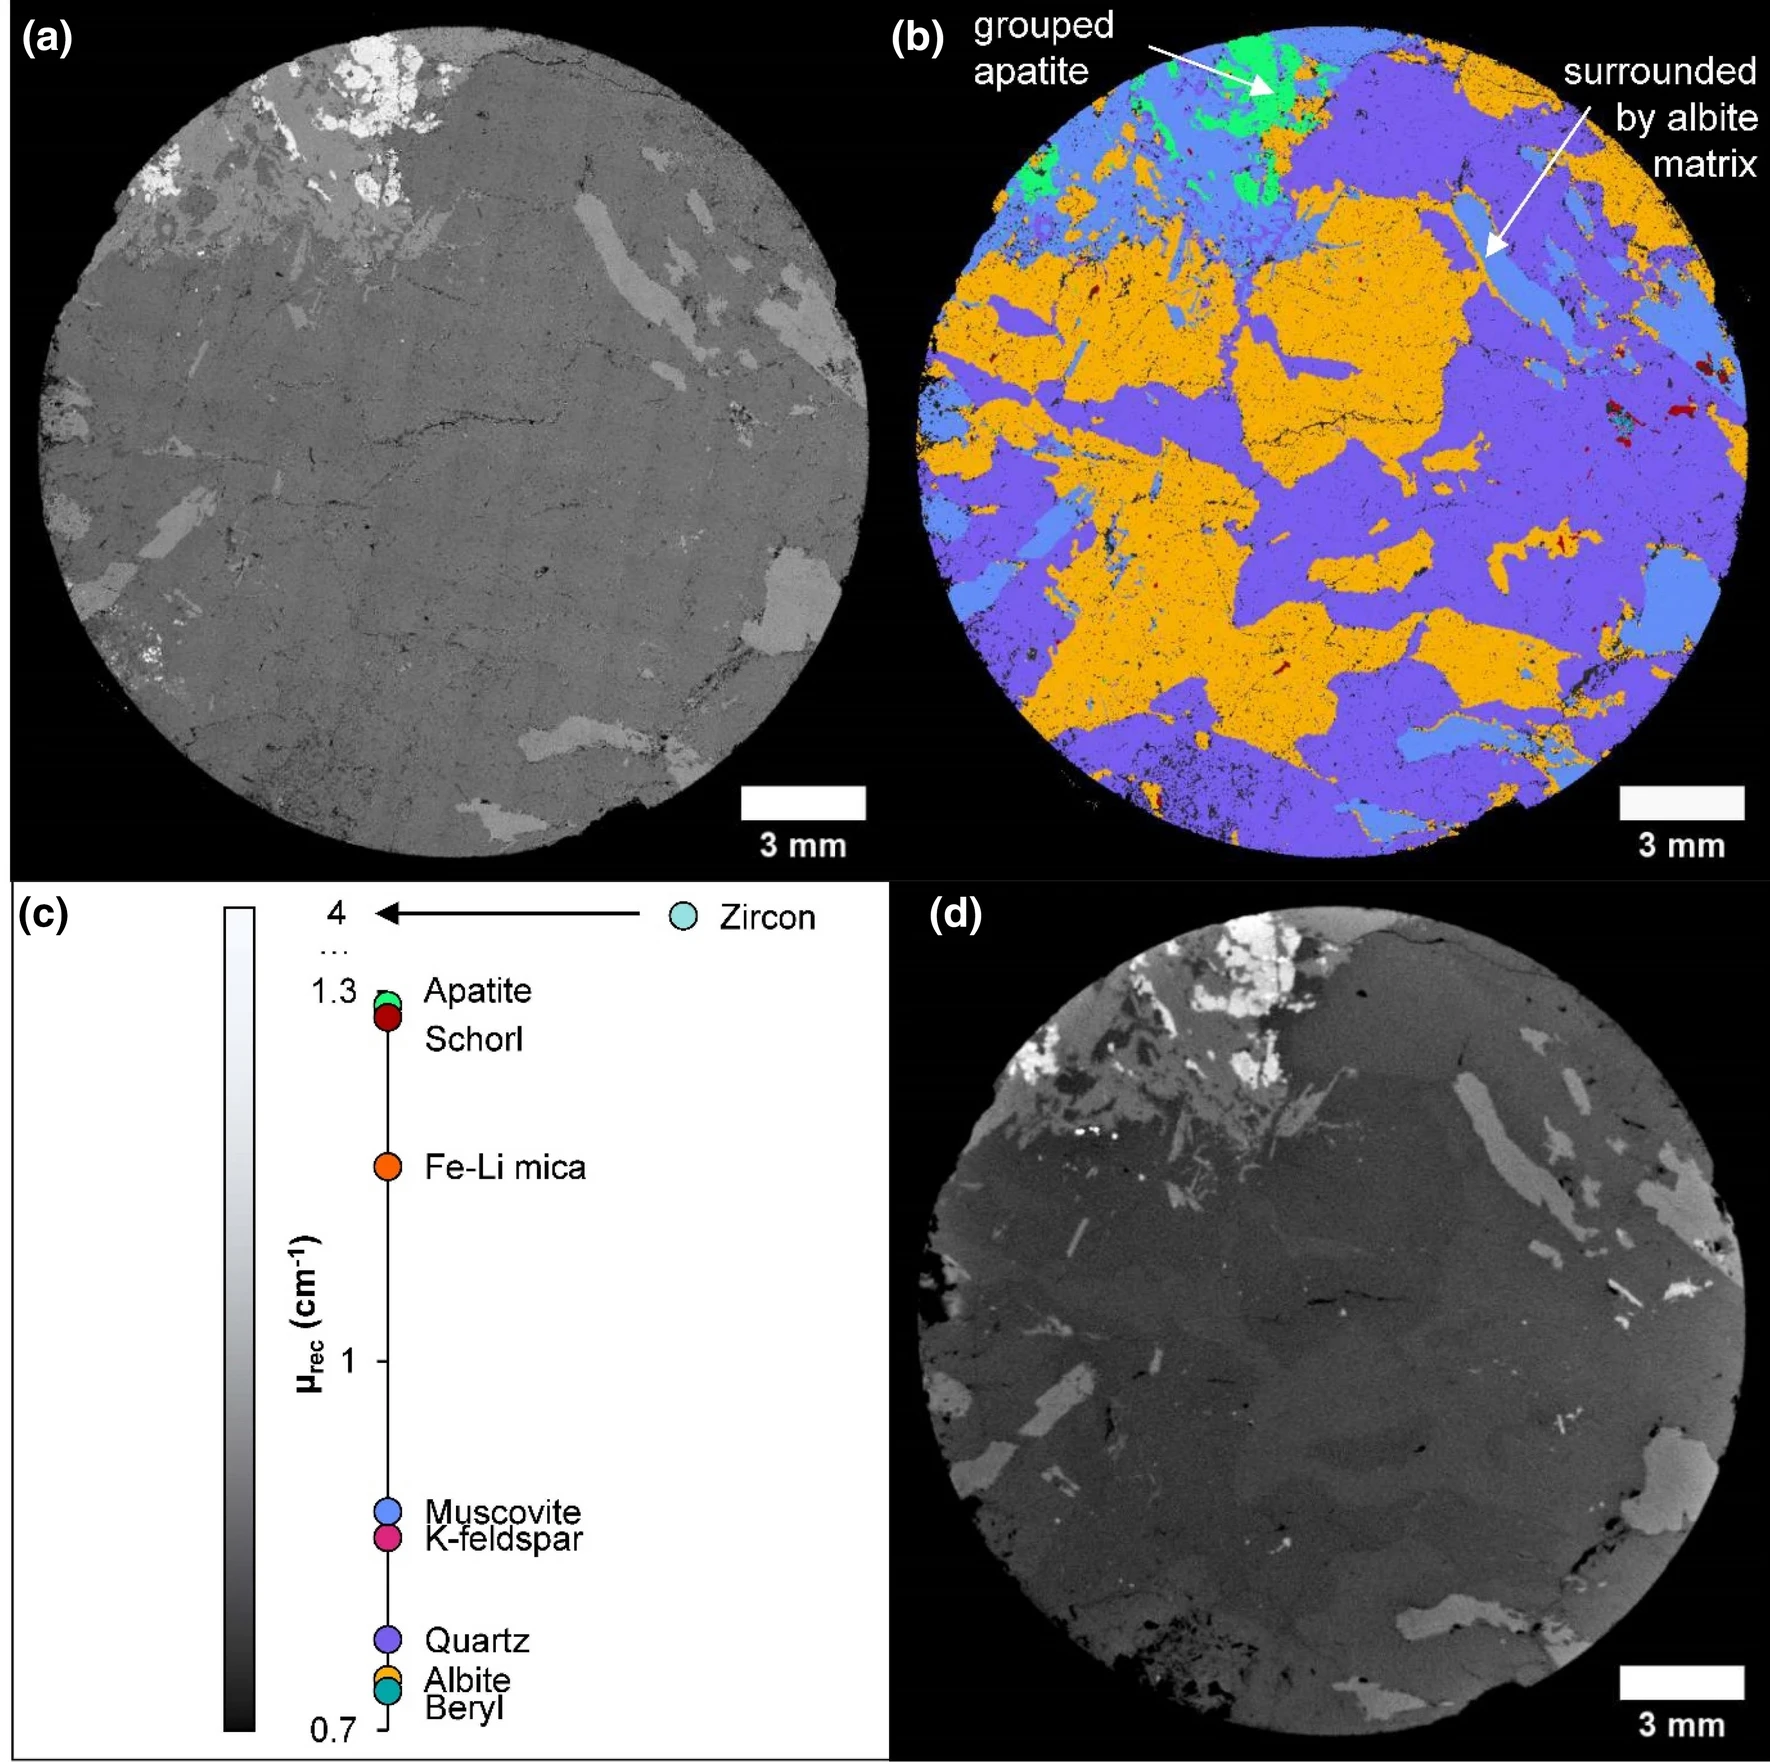
FIGURE: Mineral distribution map (acquired with TIMA-X) with the corresponding µCT slice. (a) BSE image. (b) Mineral distribution map. (c) Calculated µrec values for the identified (color coded) minerals in the mineral distribution map. (d) Corresponding µCT slice.
See also: https://doi.org/10.1007/s11053-023-10161-z
Applications
- Quantifying mineral composition and liberation in 3D.
- Analyzing grinding fineness and estimating ore sortability.
- Resource estimation, quality control, and predicting material behavior in processing steps.
Spectral X-ray Computed Micro Tomography
- Technique: Uses a semiconductor detector to obtain chemical data by detecting the X-ray absorption spectrum.
- Capabilities: Analyzes elements from Ag to U, providing detailed chemical information.
See also: https://doi.org/10.1002/xrs.3200